TASK 1:
Question: The charts show average levels of participation in education and the highest education level of adults from 2000 to 2010 in Singapore.
ANSWER:
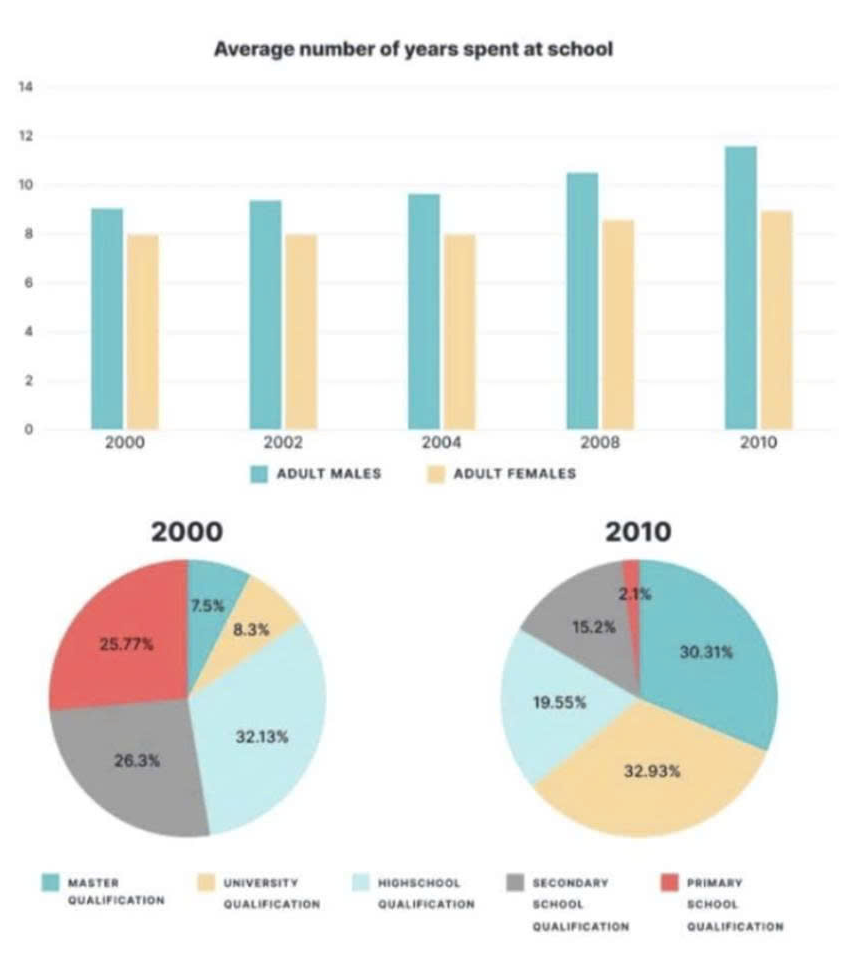
The charts illustrate the average number of years adults in Singapore spent in education between 2000 and 2010 and compare their highest educational qualifications in 2000 and 2010.
Overall, schooling duration increased steadily for both men and women over the period. At the same time, the distribution of qualifications shifted significantly towards higher education levels, particularly university and master’s degrees.
In 2000, men studied for about 9 years on average, compared with roughly 8 years for women. By 2006, these figures rose to approximately 10 years for males and 8.5 years for females. The upward trend continued to 2010, when men reached around 11.5 years of schooling, while women climbed to just under 9 years.
Regarding qualifications, in 2000 high school was the most common level at 32.1%, followed by secondary (26.6%) and primary education (25.8%). University and master’s degrees accounted for only 8.3% and 7.5%. By 2010, university and master’s qualifications rose sharply to 32.9% and 30.3% respectively. In contrast, primary education fell dramatically to 2.1%, secondary declined to 2.8%, and high school decreased slightly to 31.9%.
(178 words)
