TASK 1:
ESSAY INFORMATION:
Written by: IELTS I-Ready, 3/3/2025
Marked by: Ex-BC Examiner
(IELTS Academic – 1/3/2025)
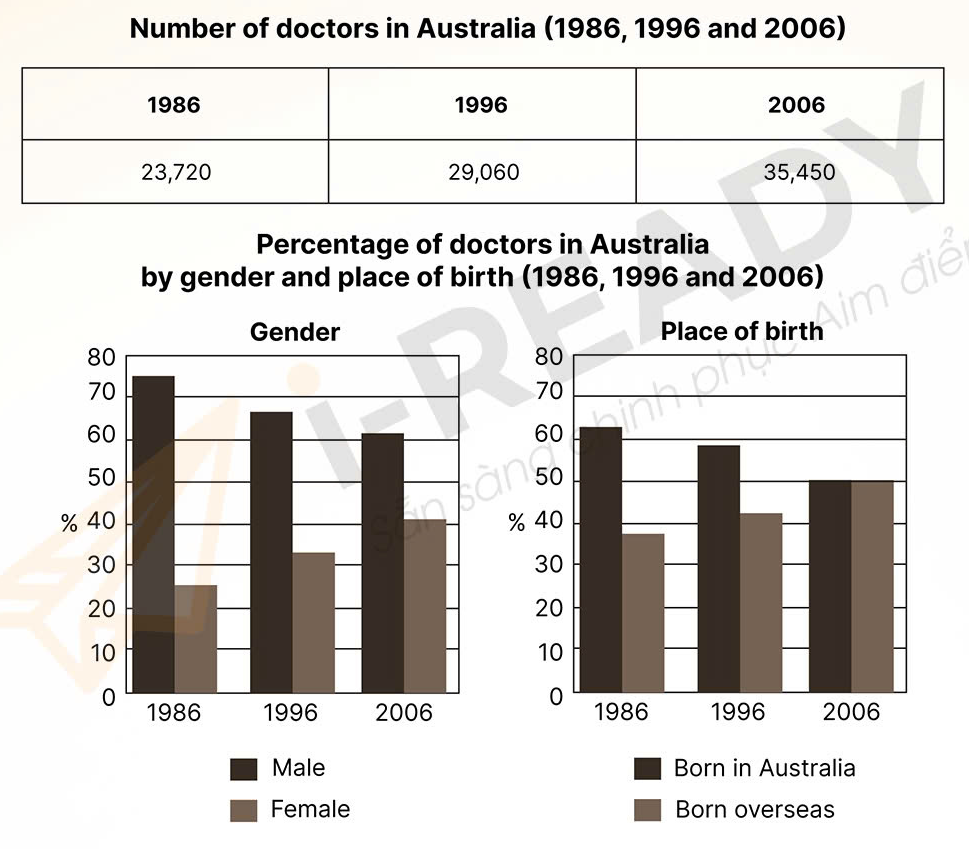
Question: The table and charts below give information about doctors in Australia between 1986 and 2006.
ANSWER:
The table illustrates the number of doctors in Australia from 1986 to 2006, while the bar graphs break down this data into compositions of gender and birth place over the same period.
Overall, the number of doctors in Australia increased over time. Additionally, even though the share of male and Australian born doctors declined over the period, they still outnumbered females and migrants, respectively.
Regarding the number of doctors, slightly over 23,000 individuals were documented in 1986. After this, an increase of approximately 6,000 additional doctors were recorded every decade to reach 35,450 by 2006.
As for gender distribution, roughly three quarters of doctors in Australia were males initially, which then dropped continuously to just over 60% in 2006. Female doctors in turn increased from approximately a quarter to around 40% over the period.
Turning to place of birth, the share of doctors born in Australia was around 65% in the beginning, which was nearly double that of those born in another country. Subsequently, the two cohorts experienced a reverse trend over the years, with that of the former decreasing and the latter increasing. By 2006, each bracket accounted for precisely a half of doctors in this nation.
(201 words)
