TASK 1:
Question: The chart below compares the number of people per household* by percentage in the UK in 1981 and 2001.
ANSWER:
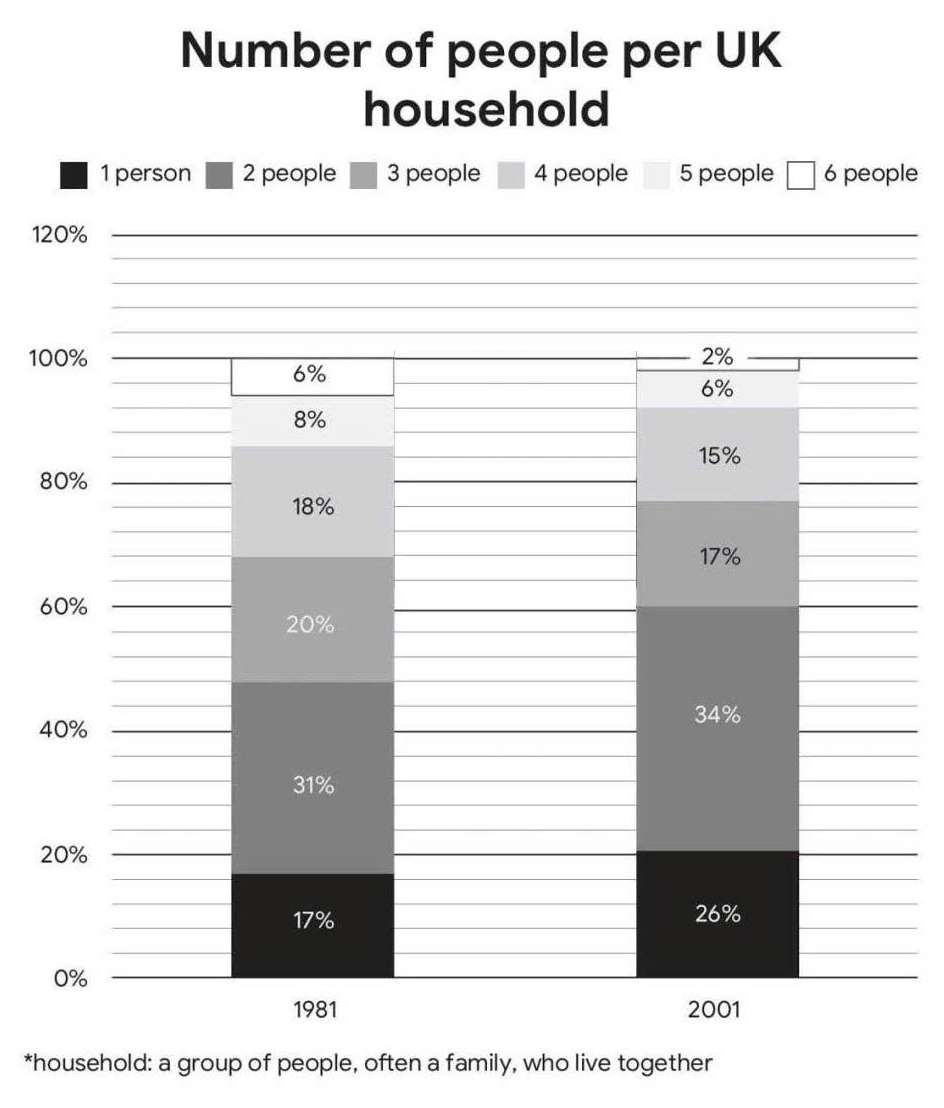
The bar chart compares the proportion of UK households of different sizes in 1981 and 2001. Overall, the shares of one- and two-person homes increased, whereas households of three or more people contracted. Moreover, two-person homes remained the dominant category and six-person households became the rarest.
Regarding the share of households with fewer members of 1 or 2 people, one-person households increased markedly, rising from 17% in 1981 to 26% in 2001. Similarly, two-person households also grew slightly, climbing from 31% to 34%, which consolidated their position as the most common arrangement.
Concerning the share of larger-family, households of three people fell from 20% to 17%, and four-person homes declined from 18% to 15%. The downward trend was more significant among larger families. Households with five members dropped from 8% to 6%, and those with six people contracted from 6% to only 2%, leaving them as an increasingly rare arrangement in the UK. (153 words)
