TASK 1:
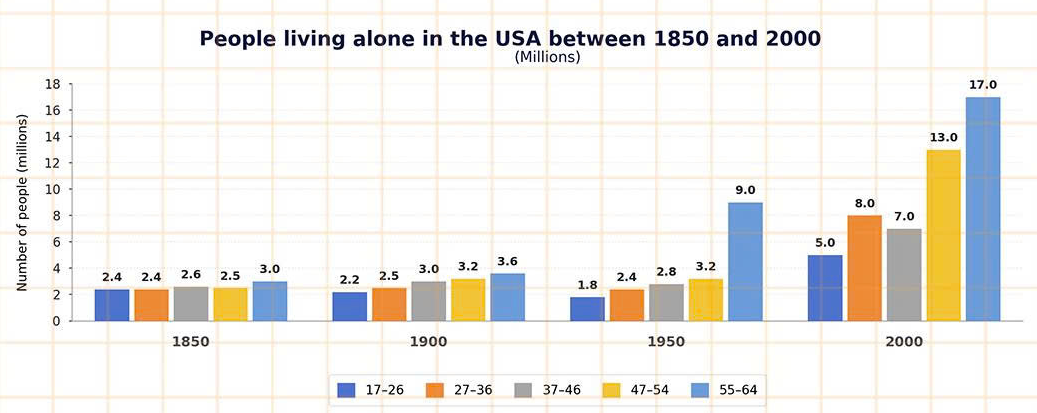
Question: The bar chart below shows the number of people, in millions, who were living alone in the USA between 1850 and 2000, by age group.
ANSWER:
The bar chart compares the number of people in five different age groups who lived alone in the USA in 1850, 1900, 1950 and 2000.
Overall, all five age groups saw an increase in the number of people living alone, although the rises were far more significant among older people. The 55–64 age group consistently recorded the highest figures and also experienced the most substantial growth over the period.
Regarding the two youngest age groups, the number of people aged 17–26 living alone stood at approximately 2.4 million in 1850. Despite falling to below 2 million in 1950, this figure subsequently rose considerably to 5 million in 2000. As for the 27–36 age cohort, its figure also started at around 2.4 million and remained relatively stable over the following century, before climbing sharply to 8 million by the end of the period.
Turning to the three older age groups, the figure for the 37–46 age bracket was approximately 2.6 million in 1850. It remained below 3 million in 1950, but then increased markedly to 7 million in 2000. The 47–54 cohort experienced much stronger growth, with the number rising from about 2.5 million at the beginning of the period to 13 million at the end, with most of this increase occurring after 1950. Finally, the 55–64 age group recorded the highest figures throughout, increasing from approximately 3 million in 1850 to 9 million in 1950, before reaching 17 million in 2000. (247 words)

