TASK 1:
Question: The chart below shows library borrowing in UK public libraries during a 10-year period from 1995 to 2005.
ANSWER:
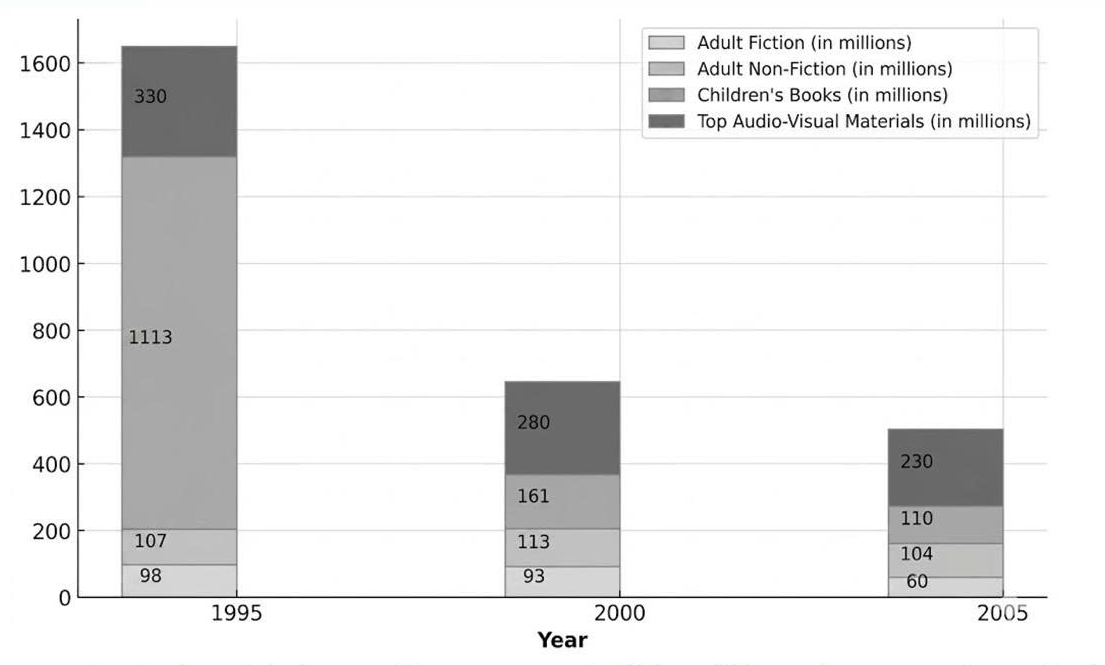
The bar chart compares borrowing in UK public libraries across four categories over a ten-year period from 1995 to 2005. Overall, all categories experienced downward trends. Children’s books were the most borrowed at the start, whereas audio-visual materials became the leading category in the later years.
At the beginning, children’s books recorded the highest figure, at 1,113 million items, then fell steeply to 161 million in 2000, followed by a further decline to 110 million by the end of the period. In contrast, borrowing of audio-visual materials decreased more gradually, from 330 million in 1995 to 280 million five years later, at which point it overtook children’s books and later fell to 230 million in the final year.
Although the figure for adult non-fiction rose slightly from 107 million in 1995 to a peak of 113 million in 2000, it later edged down to 104 million by 2005. Adult fiction followed a different pattern, dipping from 98 million at the start to 93 million in 2000, and subsequently falling to 60 million in the final year, which made it the least borrowed category at the end.
(186 words)
