TASK 1:
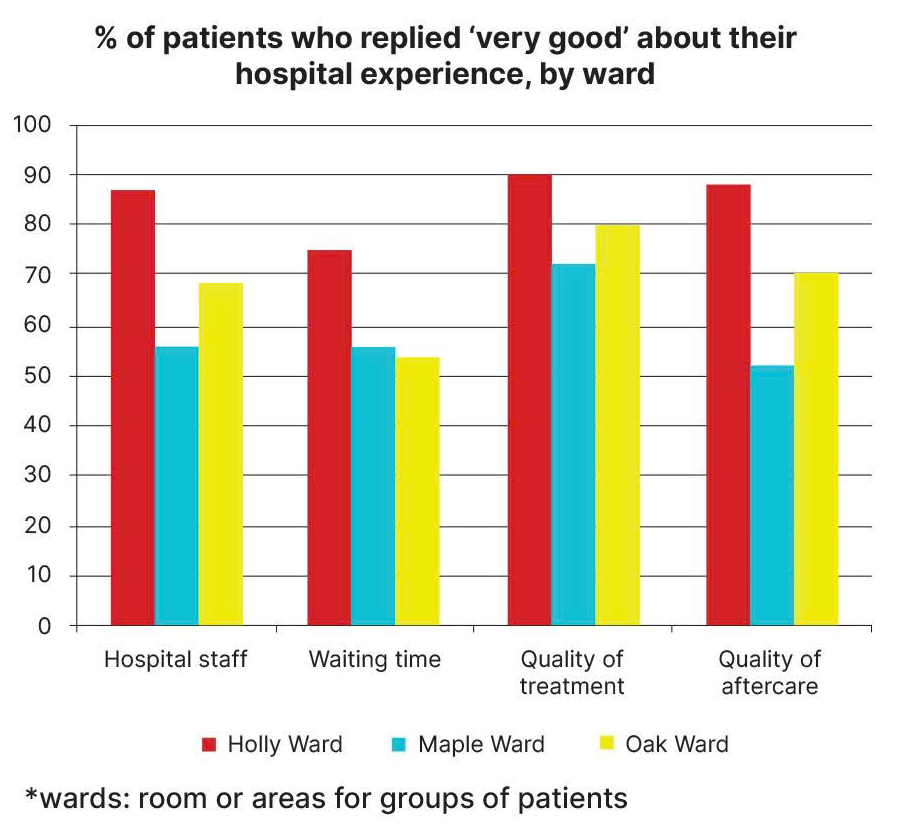
Question: The chart below shows the result of a survey of patients who stayed in three different wards of a hospital. It shows what percentage of the patients replied ‘very good’ about various aspects of their hospital experience.
ANSWER:
The bar chart compares the percentage of patients who gave “very good” ratings for their hospital experience in three different wards: Holly, Oak, and Maple. Overall, Holly Ward received the highest proportion of positive feedback across all categories, while Maple Ward generally recorded the lowest ratings, except for waiting time, in which Oak Ward had the poorest result.
Regarding the categories of both treatment quality and aftercare, the most highly rated ward was Holly Ward, with nearly 90% of patients giving very good feedback in both aspects. Likewise, the share of Oak Ward ranked second, making up 80% and 70%, respectively, whereas the corresponding proportions in Maple Ward were 70% for treatment and 50% for aftercare.
Turning to the remaining category, the highest percentage of patients who gave positive feedback for care also belonged to Holly Ward, at 85%, followed by Oak Ward and Maple Ward, at 68% and 54%, respectively. Similarly, for waiting time, Holly Ward ranked first at 75%, compared to nearly 55% in Maple Ward. Finally, the share of respondents in Oak Ward stood at the lowest level, at 48%. (183 words)
