TASK 1:
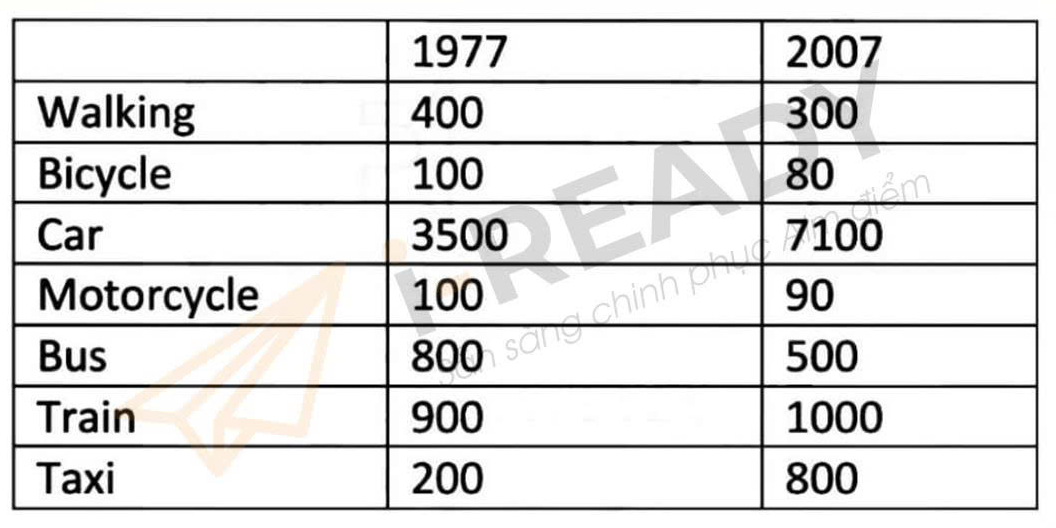
Question: The table below gives information about the average annual distance travelled by adults and the types of travel in 1977 and 2007
ANSWER:
The table illustrates the mean travel distance per annum by adults, categorized by transport methods, in 1977 and 2007. Overall, only cars, trains and taxis witnessed an increase between the two years. Additionally, the average distance traveled by cars was the highest for both years.
Regarding the increasing categories, surveyed individuals traveled 3500 km by automobiles in 1977, which then more than doubled to 7100 km by 2007. Moreover, trains accounted for a distance of around 1000 km for both years, while the figure for taxis quadrupled from 200 km to 800 km for the selected period.
Concerning the remaining categories, adults reduced their walking distance from 400 km in 1977 to 300 km in 2007. Cyclists and motorcyclists shared the lowest results of 100 km in 1977; subsequently, their respective figures declined to 80 km and 90 km in the following forty years. Finally, buses contributed to 800 km of adults’ travel distance in 1977, followed by a plunge to 500 km by 2007. (163 words)
